Snowplow Analytics: 7 Web-Analytics Use-Cases directly related to your business growth

Table of contents
- 1. Churn Prediction: Proactively Retaining Customers
- 2. Freemium Conversion: Turning Free Users into Paying Subscribers
- 3. Effective Customer Segmentation: Personalization and Targeted Marketing
- 4. Exploring Cross-Selling and Up-Selling Opportunities
- 5. Streamlining User Onboarding: Guiding Users to Success
- 6. Performance Monitoring: Ensuring Optimal User Experience
- 7. Attribution Modeling in SaaS Businesses
- How to use Snowplow Analytics for Tracking and implementing the most vital web analytics metrics?
- Conclusion: Analytics for a Competitive Edge in the SaaS Industry
Snowplow Analytics is a powerful and flexible platform that provides features to collect, process, and analyze high-quality behavioral data from your websites, apps, and other digital products. For a more in-depth introduction, please see our previous introduction to Snowplow
In this blog post, we will take you through 7 key SaaS analytics use cases which are perfectly addressed using Snowplow Analytics that can not only help you understand your users better, but also help you to make informed decisions for the future growth of your business. We will explore how data-driven analytics can empower your SaaS organization, allowing you to tackle critical aspects such as customer retention, user onboarding, product optimization, and sales forecasting.
Each chapter of this blog series will take a deep dive into one specific use case, showcasing real-world examples, success stories, and practical applications. By understanding these use cases and their benefits, you will find hidden (or also not so hidden) potential for growth, revenue and general product success.
While all of these Use-Cases can potentially also be implemented using any other tracking tool, Snowplow is an especially good fit for tracking data used für these cases, as it's a First-Party tracking tool, allows full control over what you track and in which format you track and most importantly it's very easy to add to a variety of elements in your product.
The blog attempts to give a short introduction to any of the 7 use cases, shows what metrics you want to collect and how you can use these metrics for specific actions. At the end, we'll highlights how to implement the tracking of the required metrics specifically using the Snowplow Javascript or app trackers. One disclaimer though: This post is not about in-depth tracking design, but getting an overview about where to start.
1. Churn Prediction: Proactively Retaining Customers
Churn prediction is a critical aspect of SaaS business analytics as it allows companies to forecast and identify customers who are likely to cancel their subscription and not return. Early identification of these at-risk customers enables a proactive approach to reduce churn rates and maximize customer lifetime value. For a very detailed introduction in the specifics of churn modelling, see our free guide extensively covering this topic.
Key Metrics for Churn Prediction
- Churn Rate: The percentage of customers lost during a given time period compared to the total customer count at the beginning of the period.
- Customer Retention Rate: The percentage of customers who continue their subscription during a given time period, as opposed to those who churn.
- Average Time to Churn: The average time it takes for a customer to cancel their subscription from the moment they join.
- Frequency and Recency of Login/Usage: Analyzing login frequencies and time since last login can predict potential churn risks.
- Feature Usage: Analyzing how often which specific features are used, and for how long.
- Performance metrics: Your product performance might have a crucial impact on your users churn rate - do not neglect this area of your product
- Billing and payment data: Keep an eye on payment history, failed transactions, and subscription changes that might indicate dissatisfaction or financial concerns.
- Customer support interactions: Track the number of support tickets, ticket resolution times, and user satisfaction ratings to assess the overall customer satisfaction level.
How to use Churn Predictions and Measurements for specific Actions
- Develop targeted retention campaigns: Craft personalized communication and outreach strategies to engage high-risk users, offering incentives, discounts, or tailored product recommendations.
- Improve user experience and prioritize feature development: Identify pain points and develop improvements for your product, ensuring customers' needs are being met and their issues are quickly resolved.
- Re-evaluate pricing strategies: Analyze the correlation between churn and pricing tiers, allowing you to optimize pricing strategies or offer flexible, customized pricing plans.
- Enhance customer support: Use the collected data to improve support response times, training efforts, and overall support quality, driving higher satisfaction levels.
2. Freemium Conversion: Turning Free Users into Paying Subscribers
Freemium models are widespread among SaaS companies, as they provide potential customers with the opportunity to explore a limited version of the product at no cost. The challenge lies in getting these users to upgrade to a paid plan, and this is where leveraging data analytics and understanding user behavior come into play.
Key Metrics for Freemium Conversion Measurement
To develop effective tactics for converting free users into paying subscribers, it's crucial to monitor specific metrics that signify user engagement, satisfaction, and likelihood to commit to a paid subscription. Some of the essential metrics to track include:
- Feature Usage: Identifying the most and least used features within the free version of the product.
- Users' Active Time: Measuring the duration and frequency of user interaction and engagement with the product.
- Conversion Rate: Assessing the percentage of free users who have converted into paying customers.
- Conversion Funnel Drop-Off: Identifying where users abandon the conversion process or fail to take action toward upgrading.
- Average Time to Conversion: Calculating the average time taken by users to transition from free trial or freemium versions to a paid subscription.
- Churn Rate (Lost Potential): Quantifying the number of free users that disengage from the platform without converting.
How to use Freemium Conversion Measurements for specific Actions
-
Feature Prioritization: Using usage metrics, identify top-performing features and focus on showcasing their value to free users. At the same time, consider improving or emphasizing less-used features to highlight their potential benefits.
-
Personalized Messaging: Send targeted, personalized messages to users during the trial or free period, highlighting the value and advantages of the paid version.
-
Conversion Funnel Optimization: Analyze funnel drop-off data to identify bottlenecks and optimize the conversion process, making it simpler and more attractive to users.
-
Time-Based Promotions: Assess the average time to conversion and target users at the optimal moment with special promotions, offers, or incentives to upgrade.
-
Value-Driven Webinars and Tutorials: Create content that demonstrates the value of premium features by showcasing real-life use cases, case studies, or webinars, nudging free users towards conversion.
-
Win-Back Strategies: Develop targeted strategies to re-engage and win back users who have abandoned the trial or freemium version before conversion.
3. Effective Customer Segmentation: Personalization and Targeted Marketing
Customer segmentation is the process of dividing customers into distinct groups based on shared characteristics, such as demographics, behavior, preferences, or needs. By segmenting customers, you can deliver more personalized experiences, which in turn lead to higher customer satisfaction, engagement, and retention rates. Furthermore, it enables companies to create targeted marketing campaigns that specifically address the needs and preferences of each segment.
Key Metrics for Effective Customer Segmentation
- Demographic Information: Age, gender, location, occupation, and other relevant demographic details.
- Behavioral Data: User actions on your platform, such as page views, clicks, and feature usage.
- Platform Engagement: Metrics such as adoption rate, usage frequency, session duration, and returning users.
- Product/Subscription Preferences: Type, tier, or features of subscription plans used by the customers.
- Customer Lifetime Value (CLV): A projection of the revenue a specific customer generates during their entire relationship with your business.
- Churn Rate: The percentage of customers who discontinue their subscription in a given time period.
How to take specific Actions with Customer Segmentation
- Personalized Marketing Campaigns: Create marketing materials that are tailored to address the needs, preferences, or pain points of each customer segment. This targeted approach can lead to higher conversion rates and stronger customer relationships.
- Tailored Product Offerings: Employ insights from segmentation to develop features or functions that cater to the distinct needs of different customer groups. This can result in enhanced product usage and a better overall experience.
- Optimized Pricing: Analyze the willingness to pay and subscription preferences of each customer segment to develop pricing strategies accordingly.
- Customized User Experiences: Design specific platform interfaces, help content, or user onboarding tutorials that cater to the unique requirements or preferences of each customer segment.
- Targeted Customer Retention Strategies: Use insights from demographics, engagement, and churn rate to devise retention strategies tailored to each customer segment's particular needs and preferences.
4. Exploring Cross-Selling and Up-Selling Opportunities
Cross-selling refers to the practice of promoting related products or services to existing customers, broadening their usage of your product offerings. For instance, recommending additional modules or extending services to complement a customer's current subscription.
Up-selling involves encouraging customers to upgrade their subscription to a higher tier, which usually comes with more features, better performance, or better support.
Both strategies aim to maximize the revenue from current customers while enhancing their experience and satisfaction with your products or services.
Key Metrics for finding Cross-Selling and Up-Selling Opportunities
To identify and use cross-selling and up-selling opportunities, you need to track specific metrics. The following are some essential metrics that can guide your decision-making:
-
Customer Lifetime Value (CLV): Represents the total revenue a customer will generate over the course of their relationship with your business. Higher CLV indicates greater potential for cross-selling or up-selling opportunities.
-
Product Usage Patterns: Analyzing user activity and engagement levels with different features can help you identify potential areas for cross-selling or up-selling.
-
Customer Satisfaction: Higher satisfaction levels can be a good indicator that customers are more likely to purchase additional products or services, or upgrade their subscriptions.
-
Pricing Tiers and Feature Comparison: Observe how customers interact with features that are limited by tier restrictions or are exclusive to higher tiers.
Specific Actions to benefit from upselling and cross-selling opportunities
-
Identify customer segments more likely to benefit from cross-selling or up-selling opportunities due to high CLV, usage patterns, or feature demand.
-
Tailor marketing campaigns by communicating the benefits of upgrading or adding complementary services to the segmented audience, showcasing how the additional features meet their specific needs.
-
Personalize offers based on customer data and interactions to create targeted up-selling and cross-selling campaigns, increasing the likelihood of conversion.
-
Measure campaign effectiveness by tracking key metrics such as conversion rates, customer satisfaction, and CLV to monitor the results of your cross-selling and up-selling efforts and make adjustments as needed.
5. Streamlining User Onboarding: Guiding Users to Success
User onboarding involves providing your users with the necessary resources, tools, and knowledge to successfully adopt and effectively use your application.
A successful onboarding process can significantly influence user adoption rates, customer retention, and the overall satisfaction of your customers. It is an opportunity to showcase your product's value proposition, making it important to minimize friction and create a seamless experience for your users.
Sadly it's one of the most underserved areas in the SaaS industry - as people are inclined to get new clients than helping new ones getting successful with their product. This is a huge missed opportunity.
Key Metrics for Tracking Onboarding Success
- Time to First Value (TTFV): Measure the time it takes for a new user to experience the primary benefit of your product.
- Completion Rate: Determine the percentage of users that successfully finish the onboarding process.
- Drop-off Points: Identify where users discontinue the onboarding process within the user journey.
- User Engagement: Monitor a user's interaction levels with your product during and after onboarding, such as feature usage frequency and average session duration.
Analyzing Data and Implementing Actions for Increased User Onboarding Success
To streamline the user onboarding process, it is crucial to collect, track, and analyze the right data. Here are some ways to use this data for specific actions:
-
Analyze drop-off points: Utilize collected data to identify stages where users abandon the onboarding process. Implement adjustments to reduce friction, making the experience more intuitive and enjoyable.
-
Personalize the onboarding experience: Use data on user preferences, roles, and industry sectors to tailor your onboarding content, providing a more relevant introduction to your audience.
-
Gamification and re-engagement: Encourage users to explore your product's features by incorporating gamification elements or notifications that can help in re-engaging them with the platform.
-
Leverage user feedback: Utilize user feedback data to identify potential areas to improve within the onboarding process, and consistently iterate upon it for enhanced user experience.
-
Optimize TTFV: Analyze your collected data to reduce the time it takes for users to experience the key benefits of your product. Shortening TTFV can lead to increased user satisfaction and retention.
6. Performance Monitoring: Ensuring Optimal User Experience
Performance monitoring involves keeping a close eye on various factors affecting a SaaS application's functionality, reliability, and speed. These factors are crucial in providing users with an enjoyable and glitch-free experience, which is important for user retention and customer satisfaction. By continuously monitoring performance metrics, you can quickly identify and resolve potential problems, avoiding negative consequences like increased churn rate or reduced customer satisfaction.
Key Metrics to Track for Performance Monitoring
- Load Times: Measure the time taken to load pages or components within the application. Slow load times can lead to user frustration and disengagement.
- Error Rates: Measure the frequency and types of errors encountered by users, which might indicate issues with servers, coding, or infrastructure.
- Server Response Times: Monitor the time taken by the application servers to process user requests and generate responses, ensuring optimal functionality and efficiency.
- API Performance: Assess the performance and responsiveness of key APIs integral to your application, ensuring interoperability with other services and systems.
Specific Actions to Improve Performance
- Optimization: Use the analyzed data to optimize the application's code, server infrastructure, or database configuration to address performance bottlenecks.
- Capacity Planning: By tracking resource utilization and throughput over time, businesses can be better prepared for scale, knowing when it's time to add more resources or upgrade hardware.
- Proactive Support: Monitoring error rates and system uptime enables businesses to catch and resolve issues before they significantly impact the user experience.
- Future Development: Use the insights from performance data to inform product development, and prioritize improvements or features that have the greatest positive impact on the overall user experience.
7. Attribution Modeling in SaaS Businesses
Attribution Modeling is a technique used by marketers and analytical teams to allocate credit for a particular customer conversion or desired action to the marketing touchpoints that played a role in the user journey. In SaaS businesses, attribution models help identify which channels, campaigns or content are most effective in driving user acquisition, engagement, and subscription growth. By understanding the impact of different marketing activities, you can optimize marketing strategies and allocate resources more effectively to achieve better results and increase your ROI.
Key Metrics to Track for Attribution Modeling
To create an attribution model, you need to track various metrics to weave together the entire user journey. Some essential metrics include:
- Marketing Channels: Capture the sources that users came through, such as organic search, social media, referral links, or paid advertisements.
- Conversion Metrics: Track key conversion events, such as sign-ups, trial commencements, and subscription upgrades.
- Touchpoints: Log the various customer touchpoints, such as email interactions, page visits, and content downloads, leading up to conversions.
- Time: Record the time spent between touchpoints and conversion events to help discern the most impactful activities during a user's journey.
Using Collected Data and Analytics for Actionable Insights in Attribution Modeling
- Evaluate Channel Effectiveness: Compare the performance of various marketing channels regarding conversion rates, user acquisition, and revenue generation. By doing so, businesses can prioritize channels with higher ROI and focus on opportunities for further growth.
- Optimize Marketing Campaigns: Analyze the contribution of individual campaigns to key conversion metrics to identify high-performing campaigns or content. This understanding will help refine marketing strategies, design better campaigns, and allocate resources appropriately.
- Journey Mapping and Personalization: Study user journeys to discern patterns leading to successful conversions. By understanding these pathways, businesses can enhance personalization, create more targeted messaging, and streamline user experiences that ultimately drive more conversions.
- A/B Testing: Utilize attribution modeling insights to run A/B tests on various marketing elements, such as campaign creatives, target audiences, and bidding strategies. This iterative process will empower businesses to achieve continuous marketing optimizations and improvement of overall performance.
How to use Snowplow Analytics for Tracking and implementing the most vital web analytics metrics?
Snowplow helps with implementing the above Use-Cases by providing an extensive set of trackers and plugins which allow to get data for almost any of the above metric requirements. This is more than any other solution on the market currently is able to offer.
- Use the normal pageview tracking to get a feeling for product usage, feature usage and feature usage frequency.
- Use their great pageping tracking to get accurate measurements for usage times. The Snowplow usage time measurements are one of the most accurate ones in the industry.
- Use the Performance Timing feature to know your products performance
- Use custom events/self-describing-events to track more feature-related interactions like button clicks
- For analyzing the actual churn rate, your subscription management tool might be better suited - however if it doesn't provide the required data, I've also seen Snowplow as being used to track subscription and unsubscription events, using their custom events feature
- If you have videos as part of your product, Snowplow provides outstanding video tracking support
- For tracking form inputs, use Snowplows form tracking feature
We linked the documentation to all the tracking features above to provide a good starting point for implementation.
Now that we have covered how to track the raw data needed, how can you actually get the metrics and analytics data needed for these use-cases? Snowplow also has you covered here: They provide a full suite of dbt models which provide you with a vast amount of ready-made data points based on the tracking raw data. Have a look at their very good documentation for insights on how to get started.
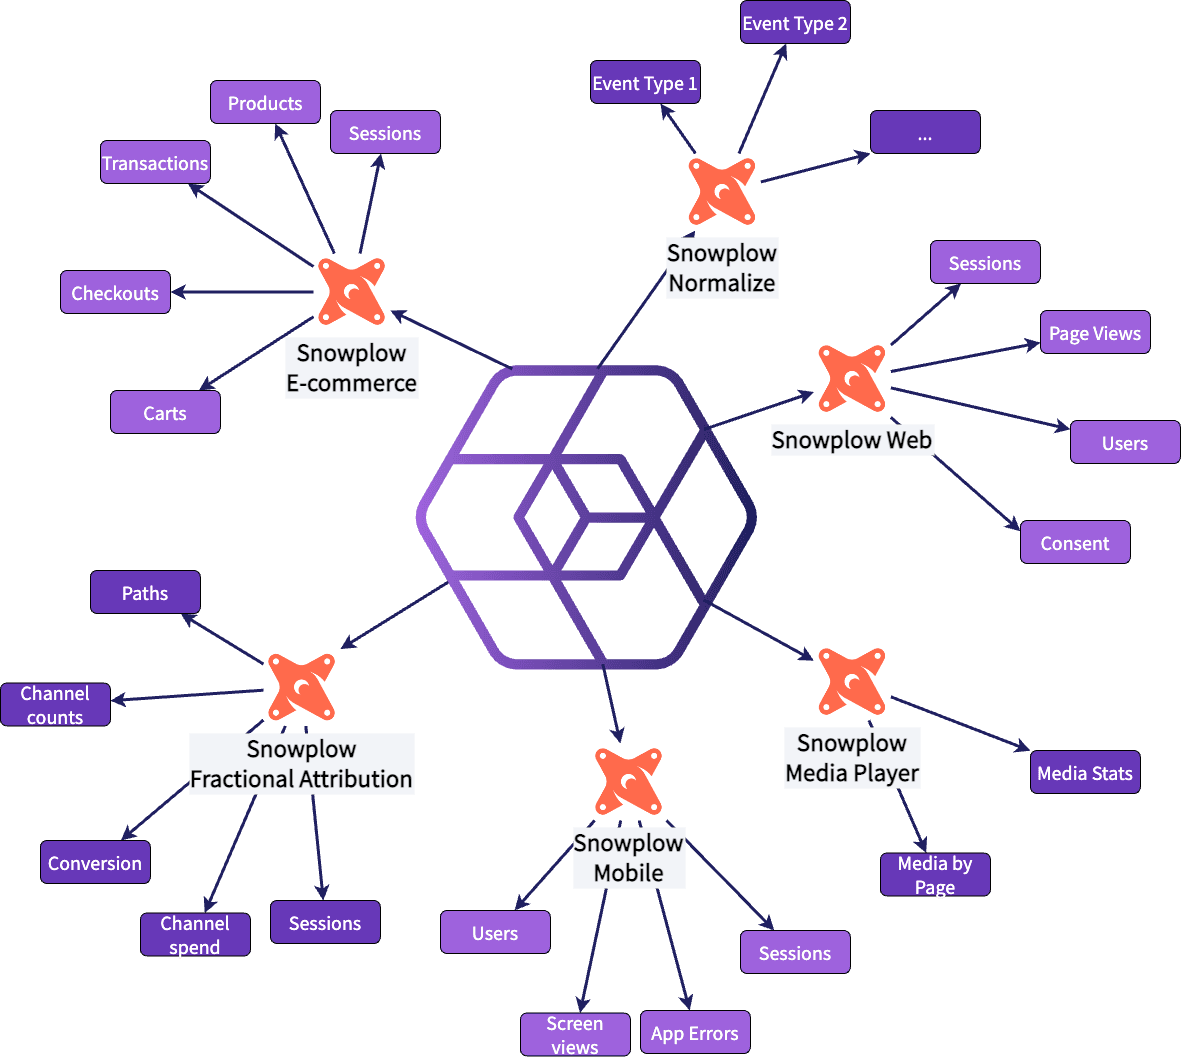 Snowplow dbt model overview
One specific dbt model to mention here is their Fractribution model - a dbt model which can be used for detailed attribution modelling. While this certainly is more than this post is about to cover, have a look in the linked description for an in-depth description about how attribution modelling with Snowplow works.
NOTE: Google Analytics just dropped their support for most of their attribution models - so having Snowplows in-depth packages is a life-saver for many.
Conclusion: Analytics for a Competitive Edge in the SaaS Industry
As we conclude our exploration of the 7 key use cases for our SaaS business, it's important to reflect on the very important role that data-driven decision-making plays in achieving success within this competitive landscape. By using data collection and data analytics, your SaaS business can stand out from the crowd, continuously improve its offerings, and find strong and lasting relationships with customers.
In order to thrive in this rapidly growing industry, it's essential for SaaS businesses to stay ahead of the curve by continuously refining their strategies based on reliable and meaningful data.
We also used Snowplow as our tool of choice for tracking product-related metrics as it provides most of the features just out of the box. Their superior first party tracking model, their huge feature set as well as their transparent data model make them a perfect partner for any customer-centered tracking endeavour.
------------------
Interested in how to train your very own Large Language Model?
We prepared a well-researched guide for how to use the latest advancements in Open Source technology to fine-tune your own LLM. This has many advantages like:
- Cost control
- Data privacy
- Excellent performance - adjusted specifically for your intended use